

Many business owners receive a marketing report every month and quietly feel unsure what to make of it. The pages are full of charts, percentages, and unfamiliar terms, the agency’s summary sounds positive, and the owner nods along without being able to tell whether the numbers actually mean the business is doing well. This is a common and entirely understandable situation, but it is also an avoidable one. Marketing analytics for business owners does not require a technical background or an analytics certification; it requires knowing a small number of things well, and knowing which questions to ask about the rest. This article is a practical guide to exactly that.
Why Understanding Your Own Reports Matters, Even With an Agency?
Accountability Without Micromanagement
Hiring an agency does not remove the owner’s need to understand what is happening, since the owner remains the person accountable for the results and for the money spent. Understanding the basics of your own reports is not about second-guessing the agency’s expertise; it is about being able to hold a meaningful conversation about whether the work is achieving what the business actually needs. A good agency welcomes informed questions, because clients who understand their numbers are better partners and tend to make better decisions together with the agency.
The Cost of Not Knowing
A business owner who cannot read a report has to take its conclusions entirely on trust, which makes it hard to spot a drifting strategy, a misleading summary, or a metric that looks impressive but does not connect to revenue. Problems that could have been caught early can continue for months, quietly consuming budget. Even a basic level of report literacy changes this, because it lets the owner notice when the story being told does not match what the business is experiencing in real life.
The Handful of Numbers That Actually Matter
Traffic Numbers in Context
Website traffic is the most commonly reported figure and the easiest to misread. A rise in visitors is encouraging only if those visitors are relevant to the business, so traffic should always be read alongside where it comes from (search, social media, email, direct visits, referrals) and what those visitors do next. A large number of visits that leave immediately and never inquire is not the same as a smaller number of visitors who read, return, and contact the business. Traffic is best treated as a starting point for questions, not as proof of success.
Leads and Conversions
The numbers closest to business results are leads and conversions: the number of people who filled in a form, called, messaged, requested a quote, or made a purchase. These are the figures that should anchor any report, and they should be clearly defined, so that everyone agrees on what counts as a lead. Because many inquiries in Lebanon and the region arrive by phone or messaging app rather than through a website form, a report that counts only form submissions may understate the real picture, and it is worth asking how calls and messages are being tracked.
Cost and Revenue Numbers
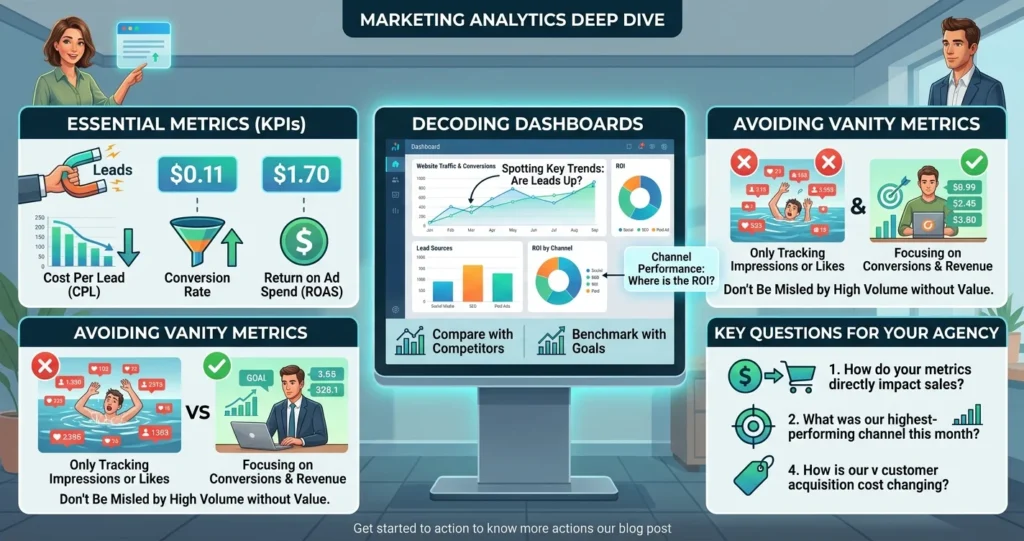
The most useful reports connect marketing activity to money: how much was spent, how many leads that produced, what each lead cost, and, where possible, how many became paying customers and how much revenue they generated. Cost per lead on its own can mislead, since cheap leads are not valuable if they rarely buy, so the figure that matters most is how much it costs to win a customer compared with what that customer is worth. If a report never mentions cost or revenue, it is telling only part of the story.
Google Analytics Basics for Business Owners
Key Terms in Plain Language
Google Analytics is a free tool that records how people use a website, and a few terms appear in nearly every report. Users are the individual people who visit, while sessions are the individual visits they make, so one person returning three times counts as one user and three sessions. Engagement describes whether visitors actually interacted with the site rather than leaving at once, and conversions (called key events in some versions of the tool) are the specific actions the business has chosen as valuable, such as submitting a form. Knowing these few terms removes much of the mystery from a typical report.
Where to Look First?
For an owner opening the tool for the first time, three views answer most practical questions: where visitors came from, which pages they looked at most, and how many of them completed a valuable action. Starting with these keeps attention on questions that matter to the business rather than on the hundreds of other charts available. Features and menu names in the tool change from time to time, so it is worth confirming the current layout with whoever manages the account rather than relying on a fixed set of instructions.
Dashboard Basics: What a Good Dashboard Looks Like
Principles of a Useful Dashboard
Good marketing dashboard basics come down to a few principles. A dashboard should be built around questions the business actually asks, show a small number of metrics rather than every available one, present numbers over time so that trends are visible, and make it clear what each figure means. A dashboard crowded with dozens of charts tends to obscure the few numbers that matter, while a clean one lets an owner see in a minute whether things are moving in the right direction.
Tools Like Looker Studio
Beyond marketing dashboard basics, tools such as Looker Studio allow marketing data from different sources to be combined into a single, shareable dashboard that updates automatically, so the owner can check performance whenever they like instead of waiting for a monthly document. The tool is only as useful as its design, however: an automated dashboard filled with the wrong metrics simply delivers misleading numbers faster. It is worth agreeing with the agency on which figures belong on the dashboard before anything is built.
Understanding Marketing Reports Across Different Channels
Reading Search, Social, and Email Reports Without Confusion
Understanding marketing reports gets easier once it is clear that each channel reports its own version of success. Search reports tend to focus on how often the business appeared and how many people clicked, social media reports on reach and engagement, and email reports on opens and clicks. These figures are not directly comparable with one another, and none of them is the final measure of results, so an owner should look for how each connects to leads and sales rather than treating each channel’s headline number as the whole story.
Keeping a Simple Glossary Handy
Because every platform uses slightly different terminology, a one-page glossary of the terms that appear most often in your own reports is a surprisingly practical tool. Asking the agency to provide plain-language definitions of each metric they report, and what a healthy movement in that metric would look like, turns understanding marketing reports from a guessing exercise into a routine habit.
How to Spot a Report That Hides Bad Performance?
Common Warning Signs
Several patterns suggest a report may be presenting an overly flattering picture. It may highlight impressive but disconnected figures, such as impressions or follower counts, while saying little about leads or revenue. It may compare results against an unhelpfully low starting point, or against a short and unusual period rather than a fair comparison. It may change which metrics are reported from month to month so that a declining number quietly disappears. Or it may offer lots of charts and very little explanation of what the numbers mean for the business. None of these proves bad faith, but each is a reason to ask more questions.
Asking for the Missing Context
When something seems unclear, the simplest response is to ask for the missing context: how this month compares with the same month last year, what the target was, why a particular number moved, and how the figures connect to enquiries and sales. A transparent agency can answer these questions readily, and a report that cannot withstand them deserves a closer look.
Questions to Ask Your Agency
A Short List Worth Keeping Handy
A handful of questions can be used in almost any report review. What are the two or three numbers that best show whether this is working for my business? How do these results compare with our goals and with previous periods? Which activities produced the most valuable leads, not just the most? What changed this month, and why? And what are you planning to do differently next month based on these results? Questions like these shift the conversation from reading numbers to making decisions.
Making Report Reviews a Routine
Reviewing reports on a regular schedule, with the same few questions each time, builds familiarity quickly. After a few cycles, most owners find they can spot unusual movements themselves, and the meetings become shorter and more useful, since both sides are focused on what the numbers imply rather than on explaining what they are.
Frequently Asked Questions
You do not need to become an expert, but understanding the basic terms and knowing how to find the key figures yourself makes your conversations with the agency far more productive and helps you verify that what you are told matches what the data shows.
For most businesses, they are the number of qualified leads or conversions, the cost of generating them, how many become customers, and the revenue they bring. Traffic and engagement figures matter mainly as explanations for those results.
A brief check weekly or monthly is enough for most owners, with a deeper review each quarter. Checking daily tends to create anxiety over normal fluctuations without improving decisions.
This is common, because reports usually count only what can be tracked online, while some sales come through calls, messages, or in-person visits. Asking the agency to explain the gap, and working together to capture offline sources, usually closes much of it.
No. A shorter report focused on the few numbers tied to business outcomes, with clear explanations, is usually more useful than a long one full of charts that nobody acts on.
Ready to Understand What Your Marketing Numbers Are Telling You?
Marketing analytics for business owners comes down to knowing a few numbers well and feeling comfortable asking questions about the rest. Creative 4 All builds clear, honest reporting for clients across Lebanon and the GCC, designed to be understood by the people who run the business. Book a Free Digital Marketing Consultation to review how your current results are being reported.