

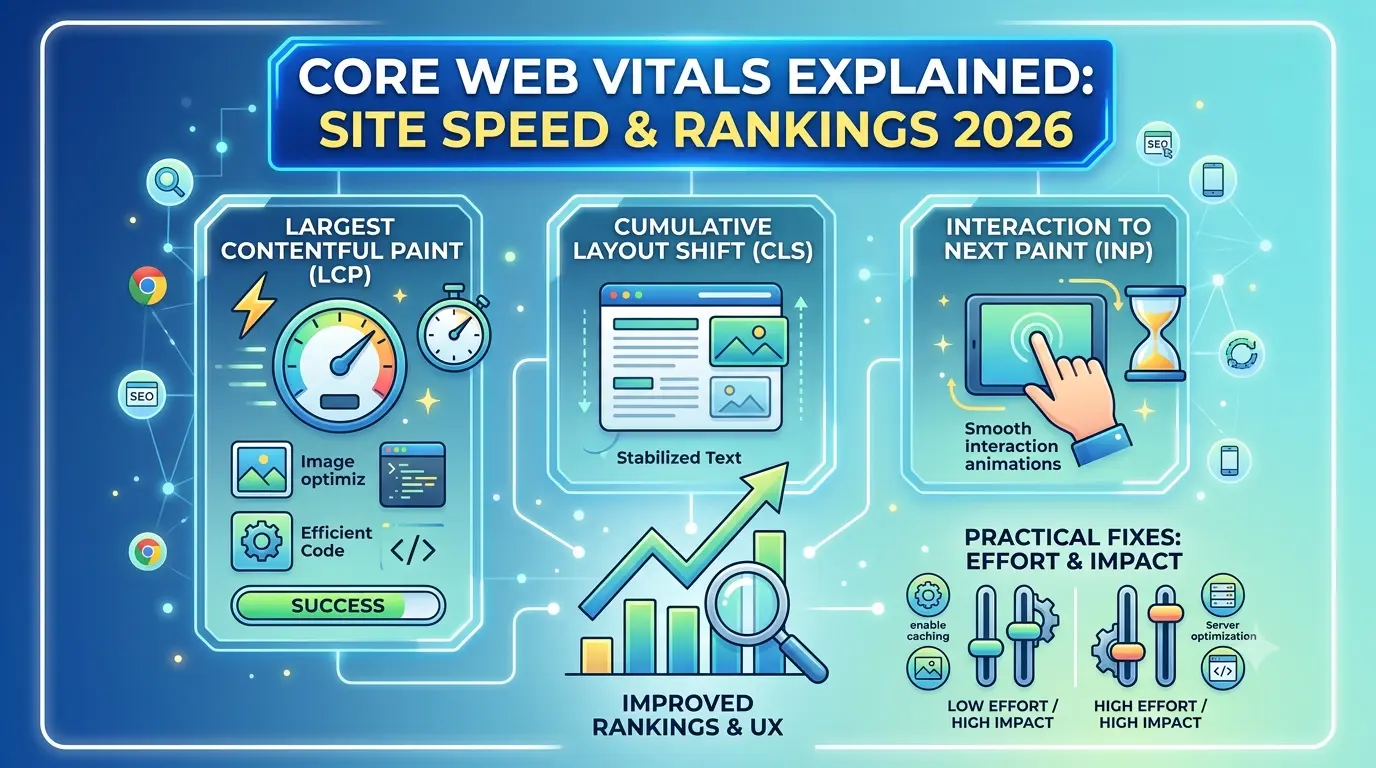
A site that looks great and reads well can still underperform in search results if it loads slowly or feels unstable while a visitor is trying to use it. Core Web Vitals are the specific, measurable signals Google uses to judge that experience, and they sit at an unusual intersection for most businesses: part SEO factor, part hosting question, part web design decision. Understanding what these metrics actually measure, and who’s actually responsible for fixing them, prevents the common situation where an SEO team, a developer, and a hosting provider each assume the other is handling site speed while nobody actually is.
This guide explains what Core Web Vitals are and why Google uses them, breaks down LCP, CLS, and INP in plain language, covers how hosting and code choices affect each metric, points to the free tools that measure them, and ranks practical fixes by how much effort they take versus how much impact they deliver.
What Core Web Vitals Are and Why Google Uses Them?
Core Web Vitals are a specific set of metrics Google introduced to measure real-world page experience — not just whether a page loads eventually, but whether it loads quickly, becomes usable fast, and stays visually stable while a person is trying to read or interact with it. Google uses these specific metrics because they’re measurable at scale across the entire web and correlate strongly with what people actually experience as “a good page” versus “a frustrating one,” which makes them a more direct proxy for user experience than older, more technical speed metrics ever were.
These metrics factor into Google’s ranking systems as part of the broader page experience signal, though it’s worth being precise about their actual weight: they’re one factor among many, and exceptional content on a moderately slow page can still outrank thin content on a lightning-fast one. That said, among pages of otherwise similar quality and relevance, Core Web Vitals performance can be the differentiator, and consistently poor scores are a real drag on both rankings and, just as importantly, actual conversion rates regardless of their direct SEO weight.
LCP, CLS, and INP in Plain Language
Largest Contentful Paint (LCP)
LCP measures how long it takes for the largest visible element on a page — usually a hero image, a large block of text, or a banner — to fully render after a visitor requests the page. In plain terms, it’s the closest approximation to “how long did this feel like it took to load” from a real visitor’s perspective, since the largest element is typically what a person is actually waiting to see. A slow LCP usually points to large unoptimized images, slow server response times, or render-blocking resources delaying when the browser can display that main content.
Cumulative Layout Shift (CLS)
CLS measures visual stability — specifically, how much content unexpectedly shifts position while a page is loading or shortly after. Anyone who’s tried to tap a button only to have an ad or image load in above it and push the button down, causing a mis-tap, has experienced poor CLS directly. This metric matters because it captures a genuinely frustrating experience that traditional speed metrics never measured: a page can technically finish loading quickly while still being unusable during that process because everything keeps moving around.
Interaction to Next Paint (INP)
INP measures how responsive a page feels when a visitor actually interacts with it — clicking a button, opening a menu, submitting a form — capturing the delay between that interaction and the page visibly responding. A page can load quickly and sit visually still, and still feel sluggish and unresponsive if every click or tap triggers a noticeable lag before anything happens. INP replaced an earlier metric called First Input Delay specifically because it captures responsiveness across an entire page visit rather than just the very first interaction.
How Hosting and Code Choices Affect Each Metric?
Hosting quality directly affects LCP through server response time — a slow, overloaded, or poorly configured hosting environment adds delay before the browser can even begin rendering content, regardless of how well-optimized the page itself is. This is precisely why site speed sits at the intersection of hosting and technical SEO rather than belonging cleanly to just one discipline: a beautifully optimized page built on inadequate hosting infrastructure still inherits that hosting’s response time limitations.
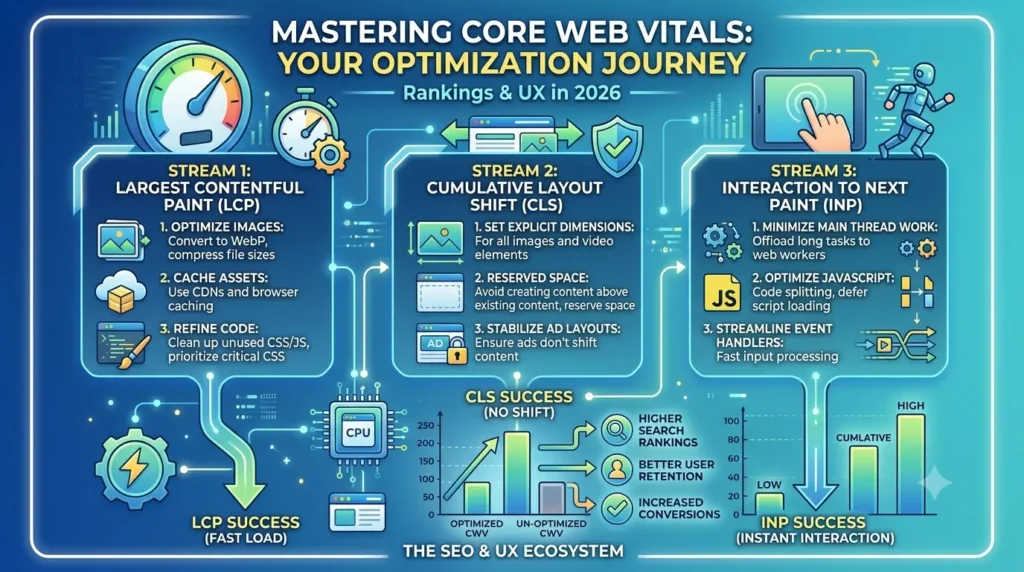
Code and asset choices affect all three metrics in different ways. Unoptimized, oversized images are one of the most common causes of poor LCP, since a browser has to download and decode a much larger file than necessary before it can display the main visual content. Dynamically injected content — ads, embeds, or scripts that insert elements after the initial page load — is a frequent cause of poor CLS, since that injected content pushes existing content around if space wasn’t properly reserved for it in advance. Heavy, poorly optimized JavaScript is the most common cause of poor INP, since a browser busy executing a large script can’t immediately respond to a visitor’s click or tap, creating the noticeable lag that INP measures directly.
A content delivery network, or CDN, addresses part of this picture by serving static assets from servers geographically closer to the visitor, reducing the latency that contributes to slow LCP regardless of how well the origin server itself is configured. Combining solid hosting, a properly configured CDN, and disciplined code and asset management addresses each metric from a different angle rather than relying on any single fix to solve all three simultaneously.
Free Tools to Test Your Site
Google PageSpeed Insights remains the most direct way to check a specific page’s performance scores across these metrics, combining both lab data (a simulated test) and, where available, real-world field data drawn from the Chrome UX Report, which aggregates actual user experience data from Chrome users who’ve visited the page. Lighthouse, built into Chrome’s developer tools, provides a similar lab-based audit along with specific, actionable recommendations tied to what’s actually slowing a page down. Google Search Console’s Core Web Vitals report shows aggregated performance across an entire site, grouping pages by their scores and flagging patterns across templates rather than requiring a page-by-page check.
Using lab data and field data together gives a more complete picture than either alone: lab data from a single simulated test can miss real-world variability across different devices and connection speeds, while field data reflects what real visitors actually experienced, aggregated over time.
Practical Fixes Ranked by Effort and Impact
Compressing and properly sizing images is typically the highest-impact, lowest-effort fix available, since oversized images are one of the most common LCP problems and image compression tools require no code changes to implement. Setting explicit dimensions on images and reserved space for dynamically loaded content addresses CLS with similarly modest effort, preventing the layout shifts that occur when content loads without previously allocated space. Enabling browser caching and a CDN typically requires a moderate, one-time setup effort but delivers a broad improvement across LCP for repeat visitors and geographically distant audiences alike.
Reducing and deferring non-critical JavaScript is a higher-effort fix that directly targets INP, since it usually requires a developer to identify which scripts are essential to initial functionality versus which can load later without affecting the visitor’s immediate experience. Migrating to better hosting or a properly configured server environment is the highest-effort change on this list, but it’s also the one that removes a ceiling on every other optimization — no amount of image compression or code cleanup fully compensates for a fundamentally slow server response time.
How This Connects to Hosting Quality?
Site speed work eventually runs into a hosting ceiling that no amount of front-end optimization can fully overcome. A business running a well-optimized, properly coded site on an overloaded shared hosting plan will still see performance scores capped by that hosting environment’s response time limitations, which is precisely why hosting decisions and technical SEO work need to be considered together rather than treated as entirely separate projects handled by unrelated teams. This is also why a business working with separate vendors for hosting, development, and SEO often struggles to actually resolve persistent speed issues — each vendor can point to the others’ territory as the likely cause, and the problem sits unaddressed in the gap between them.
Reviewing hosting fit alongside a Core Web Vitals audit, rather than assuming the current hosting plan is adequate by default, often reveals the actual root cause behind persistent performance issues that front-end fixes alone never fully resolve. A single team or agency responsible for hosting, development, and SEO together removes that finger-pointing entirely, since there’s no incentive to attribute a shared problem to someone else’s part of the stack.
Frequently Asked Questions
They’re one signal among many within the broader page experience factor, and exceptional content quality can outweigh moderate Core Web Vitals weaknesses. That said, among pages of similar relevance and quality, strong Core Web Vitals performance can be a meaningful differentiator, and poor scores affect conversion rates regardless of their direct SEO weight.
Google publishes specific thresholds for LCP, CLS, and INP that classify performance as good, needs improvement, or poor. Rather than memorizing exact numbers, the more useful approach is checking your specific site in PageSpeed Insights or Search Console, which shows exactly where each metric falls relative to those thresholds.
Some fixes, like image compression, are accessible without technical expertise. Others — reducing JavaScript execution time, fixing layout shift caused by dynamically injected content, or hosting migrations — typically require developer involvement to implement correctly.
Reviewing Search Console’s Core Web Vitals report monthly, or immediately after any significant site change like a redesign or plugin update, catches regressions before they accumulate into a larger problem.
It removes one significant ceiling, particularly for LCP, but code-level issues like unoptimized images, dynamically injected content, and heavy JavaScript still need to be addressed directly, since better hosting alone doesn’t fix problems originating in the page’s own code and assets.
Ready to Find Out Where Your Site Stands?
Site speed sits at the intersection of SEO, hosting, and web design, which means fixing it properly often requires looking at all three together rather than in isolation. Get a free SEO audit from Creative 4 All and find out exactly what’s affecting your Core Web Vitals scores today.